Animated Statistics
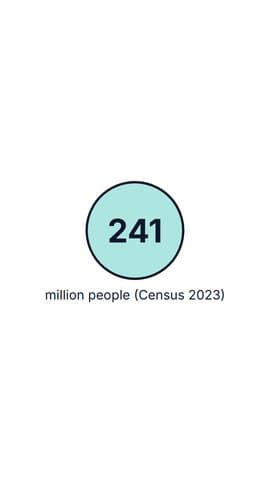
A counting stat, a bar chart and a gauge, with Pakistan census numbers as sample data.
Best for
Turning numbers into a clear, animated story.
Example prompt
[Topic] in Pakistan: [number 1] in [year 1], [number 2] in [year 2]
Replace the [slots] with your own details.
Sizes and where to use them
- 9:16Instagram Reels, TikTok, YouTube Shorts, WhatsApp Status
Tags: stats, chart, gauge
Used for
More templates
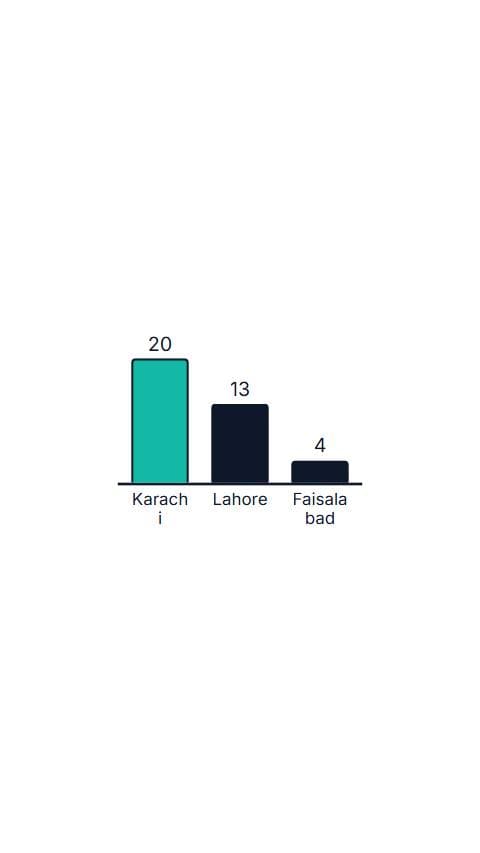 City Population BarsInfographicsView template
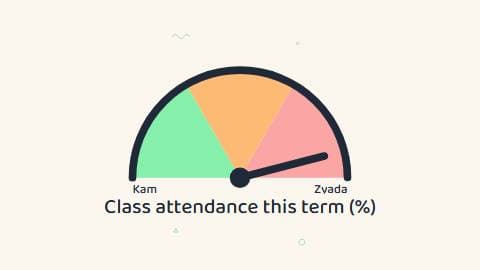 School Attendance GaugeInfographicsView template
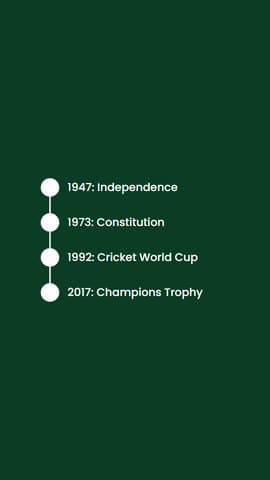 Timeline AnimationInfographics & Data VisualizationView template
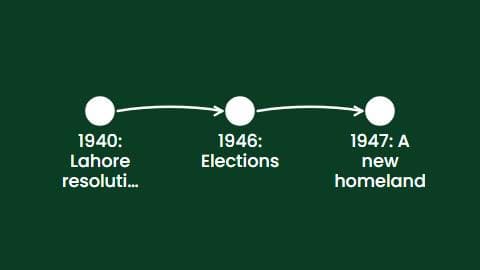 Pakistan Day 23 MarchInfographicsView template
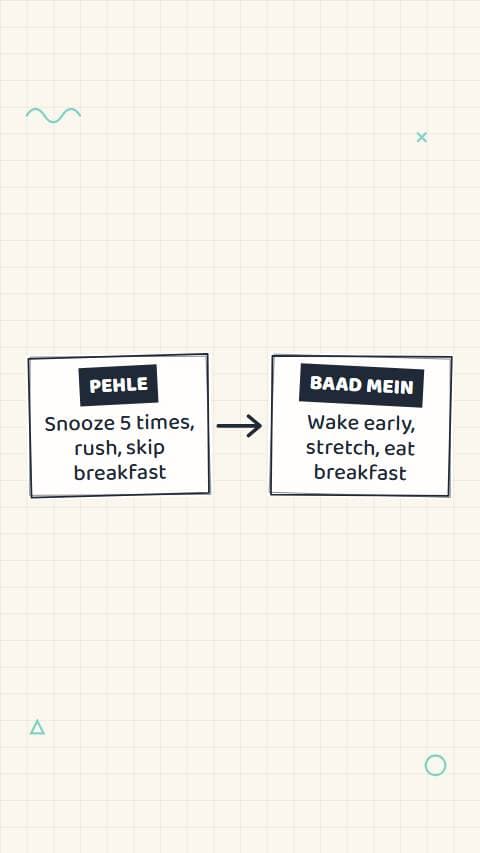 Before and After: Morning RoutineInfographicsView template
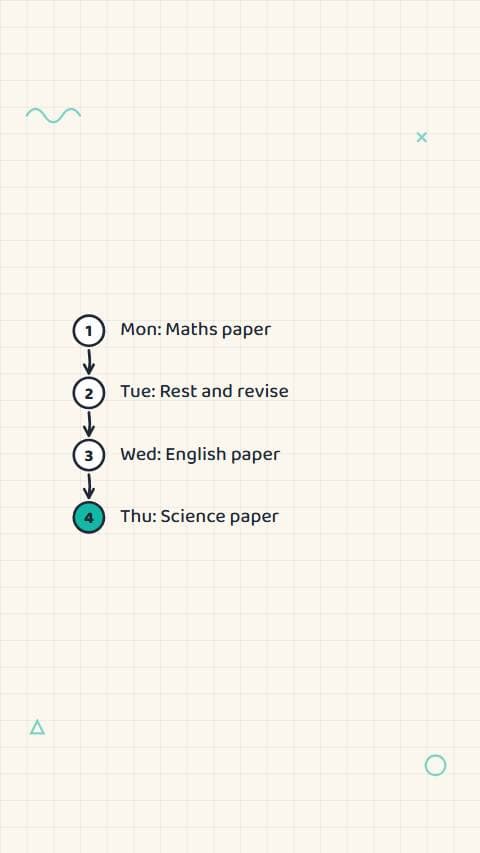 Exam Week TimelineInfographicsView template
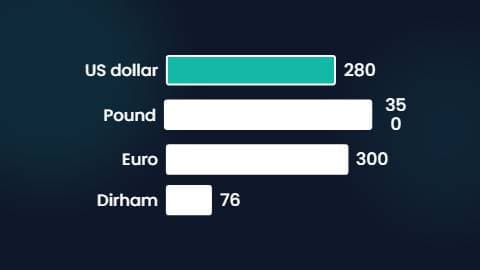 Exchange Rate Chart (Sample)InfographicsView template
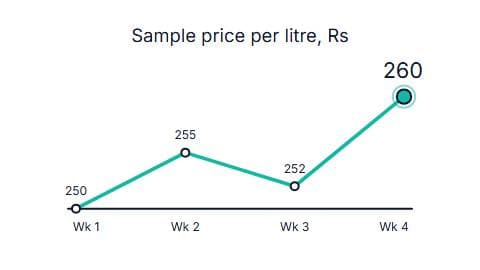 Fuel Price Explainer (Sample)InfographicsView template